Spain has been for centuries a crossroad of cultures and people, starting with Phoenician, Greeks, Romans, Germanic tribes, Arabs, etc. Without diminishing their impact, in Spain, as well as in most European countries, Romans left the most relevant and permanent footprint. We have heritage not only our language but our law, sewage and hydraulic systems, harbors… and one element which still defines the way we communicate and interact with our national peers: road networks.
When Roman Empire conquered new land, they would rush to build a meaningful and dense network of roads for different purposes, but mostly for (not exhaustive):
Provide the army with quick access to any point of the territory in case of riots and/or war Improve the flux of communication and information, including Latin knowledge spread Allow a more efficient commercial activity and assets exchange among regions We can undoubtedly recognize that Romans had a clear view about how infrastructure would play a strong integrative and cohesive role in their territory.
TWO THOUSAND YEARS AFTER
Living in the geek economy, in a multi-connected society, with low-cost flights, 5G connectivity, 4K streaming… we might think about the Roman economic model as old fashion. Or maybe not.
At Kido Dynamics, we are driven by a strong academic and research purpose, not only to make our solutions meaningful, relevant and useful for today’s society but also to understand how certain decisions that we might be taking today could impact and define the future of our children tomorrow… to the same extent that we are still impacted by what Romans did 2’000 years ago.
In that context, we have completed the largest and most extensive mobility analysis ever done Worldwide in a given region, in this case, Spain, with more than 4 billion trips analyzed over the last 12 months. Most of the breakthroughs we have unveiled will be publicly available in the coming weeks, but I wanted to share some interesting insights we have discovered while diving through terabytes of data.
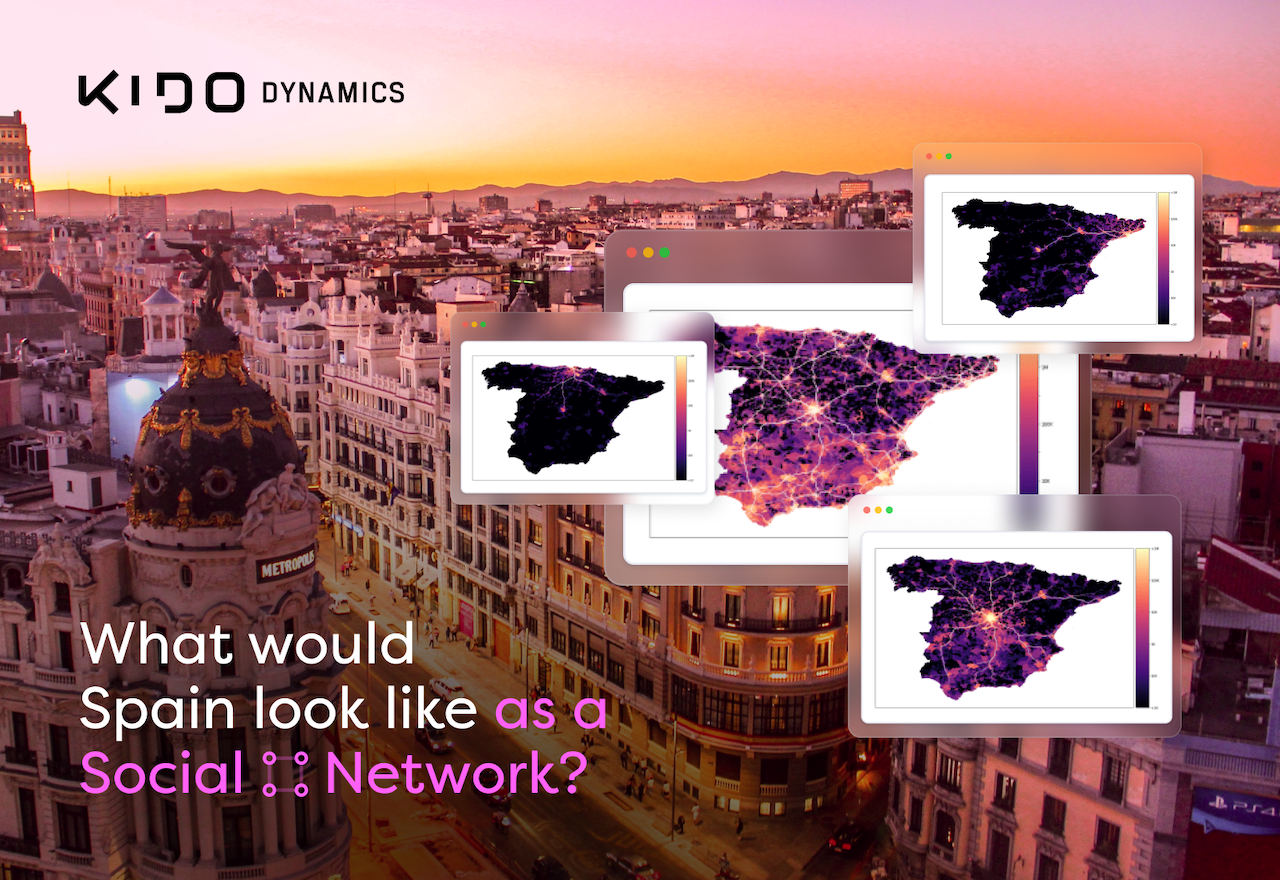
THE SOCIAL NETWORK PERSPECTIVE
In today’s digital ecosystem, social networks are an essential component of our day to day, and we concentrate a big share of our social interactions in the digital sphere.
Furthermore, at Kido we develop most of our day-to-day work in a pure digital context. But we are physicists and engineers by the trainee, and we generally need evidence about how accurate our assumptions and models are versus reality.
So, what if (certain) human behaviors could also be explained with other models, such as social networks or virality effects?
In this context, we defined a theoretical framework that would allow us to simplify some of our initial assumptions and extract relevant insights from our massive set of data. Since P2P communications would be too granular for a broad base analysis (people interact on average with a maximum of 150 people [3]), we decided to aggregate by administrative units: municipalities. Sample size: more than 15M users distributed in 8’131 municipalities in Spain.
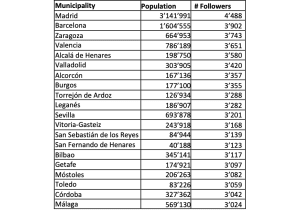
As described previously, the base of our work was the number of trips that people from every municipality performed over the 12 months of 2018, so we classified all municipalities based on the number of trips that each municipality generated or received from any other municipality. Under this context, we play the next game: we define that a municipality is a follower of another as long as there were more than 10 trips originating in its territory with the second municipality as the destination. The more municipalities connected, the more followers, and the more popularity. In this social network, who are the influencers[4]?
To our surprise, more population does not necessarily imply being popular. There is a correlation indeed, but we can find remarkable cases such as San Fernando de Henares which is higher in the ranking than other capital cities with more than six times its population. A reader familiar with Spanish geography will immediately find that San Fernando, as a satellite city of the country’s capital (Madrid) has a privileged location both geographically and in terms of infrastructure. And this is totally true. However, this same reader would also think that L’Hospitalet (55th, 2’532 followers), a member of Barcelona’s metropolitan area with a density of population double than that of Manhattan, should also be in the top of influencers. But it is not. The underlying dynamics is complex and sometimes unexpected.
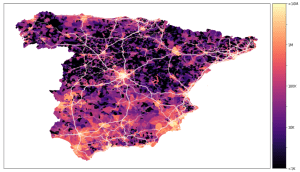
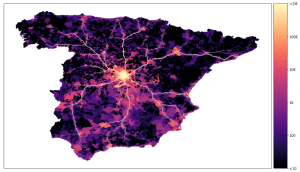
If we represent the total number of trips received per municipality, we find interesting patterns:
Figure 2. Heat map of the number of trips for every municipality. Source: Kido Dynamics
Municipalities with the highest number of followers are located along main roads or close to infrastructure hubs.
Full regions in Spain condensate the lower rankings in the number of followers.
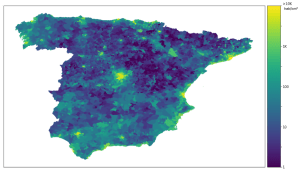
It is well-known that the area of municipalities in the south are bigger than those in the north for historical reasons (same effect as the US counties from East to West) so one may think that it is related to the fact that the bigger the area, the bigger the population. But things, as usual, are more complex: this is the so-called España vacía [5]or Empty Spain, as can be seen in the population density map of the country below. Ironically, Spain is one of the European countries with the lowest overall density of population, but it also owns the city with the largest density of population of all Europe. Spain is complex.
Figure 3. Spanish population density map. Empty Spain vs the peaks of the population are clearly visible. Source: Kido Dynamics
Since we had a nice level of disaggregation, we decided to dig deeper and analyse for multiple municipalities of different size, not only the number of connections or followers they had, but also how these followers were distributed across the geography.
Case 1: Madrid
Figure 4. Connections between Madrid and the rest of the territory in Spain. Source: Kido Dynamics
Not many comments in this case. The largest metropolitan area in Spain is systematically connected with any point of the territory, which is also favored thanks to its central position.
Case 2: Barcelona
Figure 5. Connections between Barcelona and the rest of the territory in Spain. Source: Kido Dynamics
The second largest metropolitan area in Spain has strong bias in terms of communications towards surrounding heavily populated regions such as Valencia, Alicante, Zaragoza and Madrid, while exchange and trips to the West part of the country is barely testimonial.
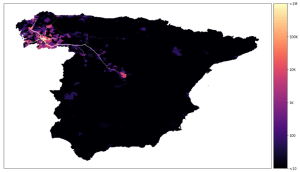
Case 3: Bilbao
Figure 6. Connections between Bilbao and the rest of the territory in Spain. Source: Kido Dynamics
An important industrial pole in the North with strong influence in the surrounding region (Basque country, Navarra, Cantabria, Palencia, Burgos) and strong communication links with Madrid, Zaragoza and Valladolid.
Case 4: Orense
Figure 7. Connections between Orense and the rest of the territory in Spain. Source: Kido Dynamics
Orense represents a typical regional hub, with strong connections with surrounding regions, but very limited (or inexistent connections) with the rest of the territory.
With a difficult orography, Galicia region has always been somehow isolated from the rest of Spain, developing its own local economy ecosystem. It’s important to note that many of these out of the region connections are happening across and along three main communication axes: AP-6 (Valladolid and Madrid), A-8 (Asturias) and A-66 (Gijón/Badajoz).
Case 5: Siruela
Figure 8. Connections between Siruela and the rest of the territory in Spain. Source: Kido Dynamics
We chose for our last example a 2’000 inhabitants village in so-called Empty Spain. We can clearly observe that:
The number of communications decreased enormously, with no municipalities receiving over 1’000 accumulated trips.
Most of the trips are concentrated in a few municipalities surrounding the village
Important to note: travel distance from Siruela to the closest speedway (nearby Don Benito) is 90 km or 60 min, while the travel distance to Madrid is 3 h 20 min for 274 km. Similar time to Madrid-Valencia with almost 100 km more.
Not surprisingly, Siruela’s neighbors visit Madrid, Badajoz (2h 12 min) or Córdoba (2h 13 min), but do not even consider visiting Sevilla, Valencia, Barcelona or Bilbao.
FINAL CONSIDERATIONS
It is important to appreciate how infrastructure acts as a territory integrator, facilitating access to multiple locations in a safe and fast way. There are multiple studies and analyses regarding this phenomenon, but in most of the cases are based on a limited/reduced sample and concentrated in a small region or metropolitan area.
To our understanding, this is the largest and most exhaustive analysis ever done in a country to understand how infrastructure layout underpins communications, trade and exchange among municipalities, regions and ultimately, people. (Utilising number of trips as a basic, simplify proxy for this analysis)
In that context, we are still bearing what Romans decided 2’000 years ago, since most existing speedways are just reflecting the ancient Roman calzadas, with better bridges, tunnels and security, but they still connect the same points defined 20 centuries ago.
We need to ask ourselves if many of the decisions related to infrastructure and mobility investment we are taking today are based in what we consider optimal for today’s needs, or if they are still based in assumptions and mindsets that we have inherited, while we have a massive, powerful and limitless set of data which might help us to optimise (and rethink) this process.
So what will you do next time you have to invest billions in a new speedway to dynamize a region? Trust Romans or trust Data?
[2]The workings of the maximum entropy principle in collective human behaviour. A Hernando, R Hernando, A Plastino, AR Plastino. Journal of The Royal Society Interface 10 (78), 20120758
[3]Unravelling the size distribution of social groups with information theory in complex networks. A Hernando, D Villuendas, C Vesperinas, M Abad, A Plastino. The European Physical Journal B 76 (1), 87-97
[4]We do not include those municipalities with less than 300 inhabitants (which are mostly those with less than 10 trips per connection) to protect the privacy of the users by working with large aggregated values only.
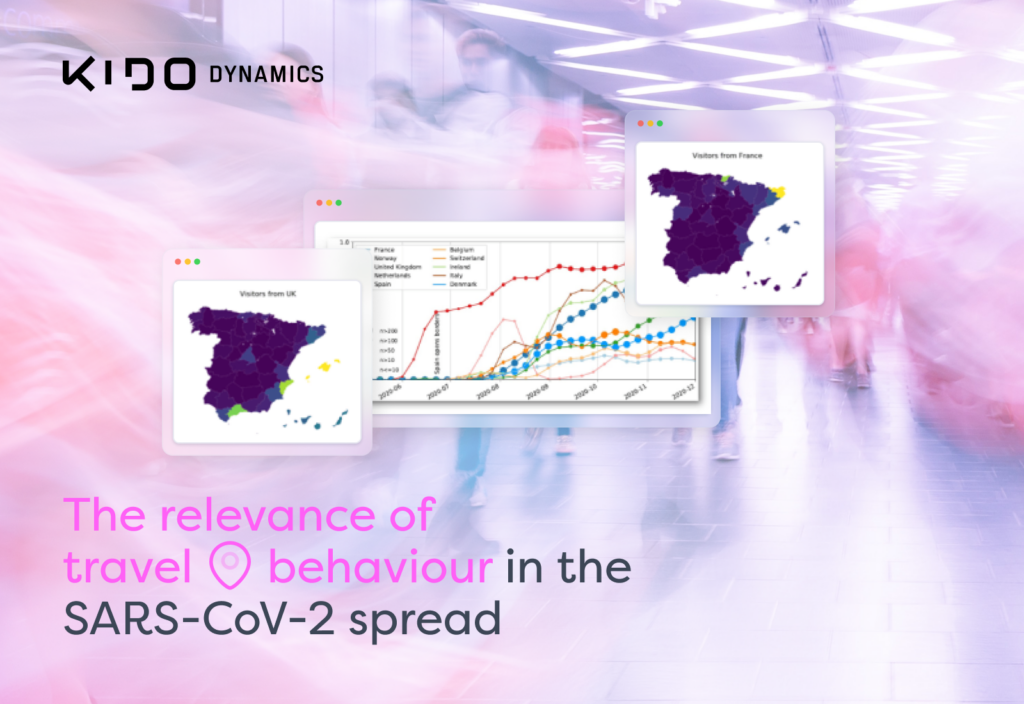
Alberto Hernando shares the results of our collaborative paper on the spread of SARS-CoV-2 and the model Kido Dynamics built correlating the people’s mobility and visualising how the virus spread.