How many people were sticking to confinement measures in 2020?
July 1, 20214 min read
Almost two weeks after confinement was announced in Spain, citizens are responding very positively to these measures from a mobility point of view
Confinement measures announced by the Spanish Government on March 13th 2020 have had a strong impact on people’s mobility patterns, with decreases ranging from 40% to 80%.
However, it looks like these measures are achieving or have achieved a plateau, where no further decrease in mobility could be expected in the coming days. It will be necessary to closely monitor how COVID-19 continues to spread, since further measures might be required in order to limit even more people’s mobility, and hence decreasing likelihood of social contact, specially when looking at inter province figures.
After almost two weeks of confinement, we have analyzed if people are still responding to these measures and to what extent, from 6 different perspective:
Micro-mobility within M-30 area
Mobility within M-30 area
Mobility between M-30 area and Madrid region
Mobility between M-30 area and provinces
Mobility within Madrid region (excluding M-30)
Mobility between Madrid region (excluding M-30) and provinces
1) Micro-mobility within M-30 area
As we saw in our previous analysis, micro-mobility has decreased an astonishing 62% if we compare March 9th with March 25th. This implies that 2 every 3 micro-trips are not happening within M-30 limits.
Furthermore, we can see an additional 13% decrease between March 16th-18th and March 23th-25th, but how the trend is stabilizing, which might imply that confinement measures are achieving its maximum citizens’ response.
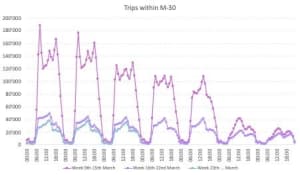
2) Mobility within M-30 area
A similar trend can be observed in those trips happening within M-30 limits, with an overall decrease of 80% and an additional 21% week to week decrease.
Total number of trips maintains a continuous decreasing trend, with a day to day decrease of 6%, but certain hour ranges are stable, which might also indicate a maximum system effectiveness happening in the next few days.
3) Mobility between M-30 area and Madrid region
We can see again how communication between M-30 limits and the rest of Madrid region has decreased up to 80% between March 9th and March 25th.
In this case, day to day decrease has almost achieved saturation, with just 4% additional decrease in traffic between March 24th and March 25th. Nevertheless, this percentage still represents 50’000 trips, and it is important to note that once a certain level has been achieved, further improvement becomes more complicated.
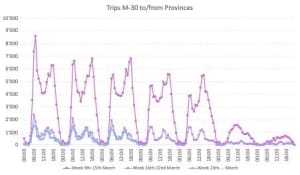
4) Mobility between M-30 area and provinces
From a confinement perspective, this metric and number 6 is incredibly important, as they determine the likelihood of COVID-19 keep on spreading across regions, since this is a direct measure of potential contact among people living in Madrid region and other regions.
We can see how these trips basically disappeared on March 21st and 22nd (weekend): we identified less than 5’000 people leaving this area, when a normal weekday register 90’000.
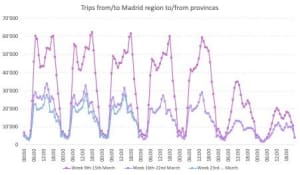
5) Mobility within Madrid region (excluding M-30)
Madrid region (excluding M-30 area) holds on a normal weekday more than 10M trips. After confinement measures were announced on March 13th, we have seen a decrease of 44% in the number of trips happening, if we compare March 25th (4.6M) with March 9th (10.8M). Furthermore, it looks like this area is very close to saturation, with a day to day decrease of just 3% between March 25th and March 24th.
Considering the number of trips hosted in this area, and the limited reduction in terms of mobility, it might be necessary to consider further confinement measures depending on new COVID-19 cases in the region.
6) Mobility between Madrid region (excluding M-30) and provinces
Finally, trips between the Madrid region excluding M-30 and other provinces have experienced a 58% decrease compared to normal values. Considering that most of the logistic and trading areas in Madrid, as well as many business areas are located in this region, this limited decrease indicates that an important economic activities and people’s exchange is happening between this region and the rest of Spanish’ provinces.
Likewise, day to day decrease (24th to 25th) has saturated, this is, no further decrease in traffic has been detected between these two days, which might indicate that confinement measures have achieved its maximum effectiveness.
This article has been written by the Kido Dynamics team, including Dr. Alberto Hernando, Dr. David Mateo, Jordi Escrich, Jordi Bayer, Raul Vallespin, Agustin Marrone, Luiz Viotti, Antonio Andrade, Carlos Roldán, Miquel Mateos, Bilal Khan and Juan Carlos Sanchez.
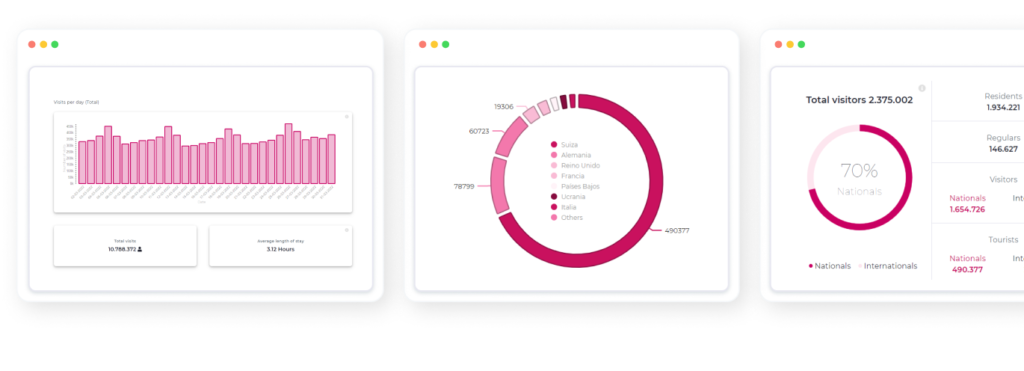
Sharing highlights and some interesting insights we have discovered while completing the largest and most extensive mobility analysis ever done worldwide. We analysed more than 4 billion trips in Spain in the span of 12 months. Read more about our findings here.
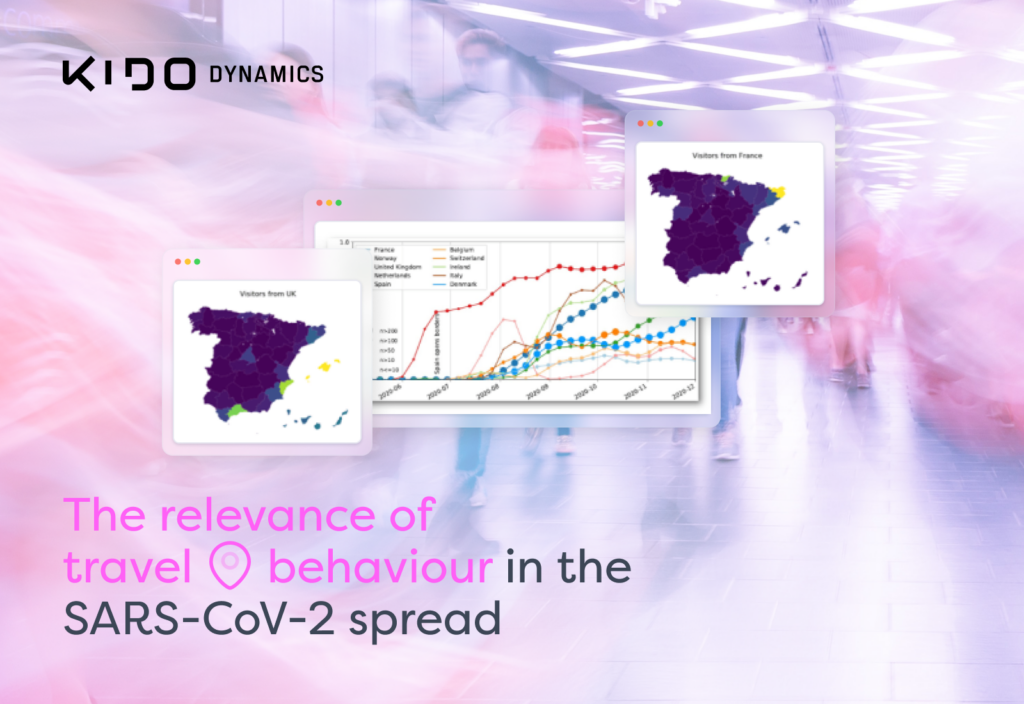
Alberto Hernando shares the results of our collaborative paper on the spread of SARS-CoV-2 and the model Kido Dynamics built correlating the people’s mobility and visualising how the virus spread.